
My name's Niketh Sabbineni and in this article, I'm going to be talking about time series forecasting.
There are a lot of things involved in doing time series forecasting in real-time and doing this at scale. I'm going to look at some of the components you need to achieve this.
About me
I'm a Principal Engineer for Flurry Analytics, I work on the platform team. That's where all the cool stuff happens. We work on HDFS, HBase, Kafka, and all the big data stuff.
Also one of the committers for Apache Druid, it's currently incubating, we should be out of that soon. I was the CTO of Bookpad, a document review software that Yahoo acquired about four years ago, I've been at Yahoo since.
I spent some time at Amazon before that.
Overview of Flurry
I'll use a lot of references in this article to the use cases so I just want to do a quick overview. Flurry Analytics lets app developers measure events. We help them analyze, we generate insights and we let people take action on these insights.
Actions could be push notifications, email notifications, campaigns, and stuff like that. The way we do that is we have an SDK, this SDK people can embed in their apps, and then they can send us events over.
So we have about 1 million apps on our platform, we have about 2.1 billion devices, we see about 110 billion events coming in daily, about 10 billion sessions daily, and our auditor is well over 20 petabytes.
Features
Some of the features it does are provide real-time analytics, crash analytics real-time, and you can see how your app is performing in real-time.
- How are people using it?
- Where are people using it?
- How often the app crashes; crash rates.
- Technical - what sort of OS are users using, which version of the operating system?
- Device dimensions?
- Audience information - age, gender, demographics.
- Retention queries, and
- A lot of other stuff.
The best part is it's all free. We have no limits.
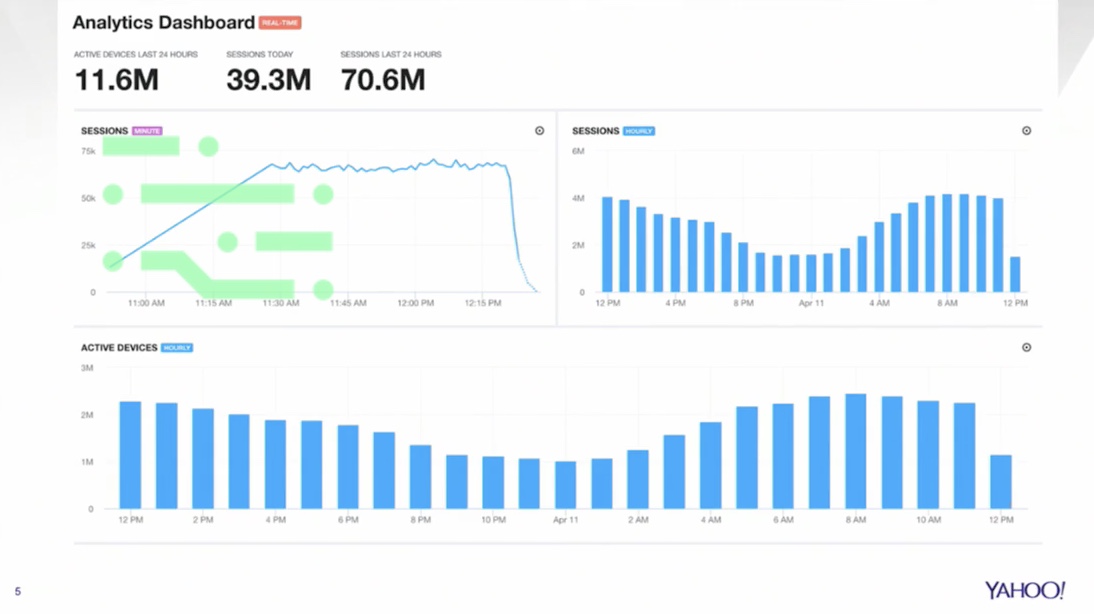
Analytics dashboard
This is a sample dashboard that most users would see, this is the real-time dashboard, you can see your active devices, you can split it by day, week, and month.
Revenue dashboard
This is an example of a revenue dashboard.
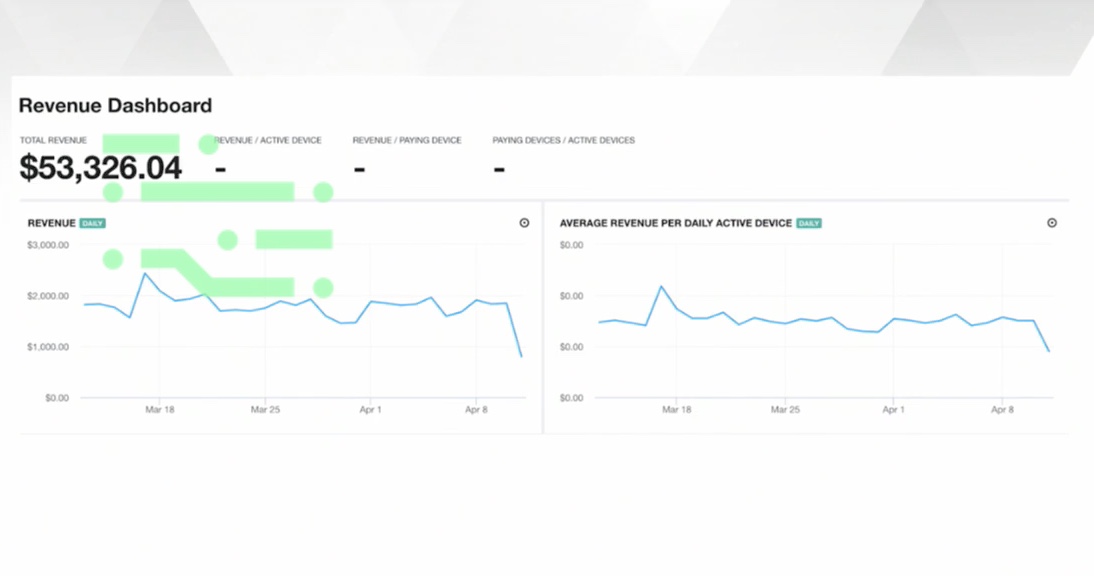
You can check the revenue per device, per day, and things like that.
Retention dashboard
There's another super interesting dashboard for the retention analysis.
We have both fixed window and rolling retentions so app developers can see if a person installs the app and uses it on day zero, what's the likelihood they will take today 1, 2, 3, 4, and so on.
Druid
To enable all of these things, we use a software called Druid. Druid is a time-series database, it's open source.
Druid allows you to slice and dice your data, you can do exploratory analysis, you can load up all your data, you can add filters, and different queries can be fired on that.
It's incredibly fast, and it's very scalable. A lot of companies use Druid; Yahoo, Netflix, Airbnb, Unity, Branch, and many, many more.
Why Druid?
The question is, why use Druid in this context of time series forecasting?
One of the reasons is because Druid does both real-time and batch. It's very horizontally scalable. The sub-second query latencies are super, super low.
It's very resilient to failures and you can really customize this. Each company has written its own custom plugins to customize Druid to work for them and their specific use cases.
Use cases
Churn prediction
One of the use cases that are relevant to this article is churn prediction.
For example, Angry Birds uses Flurry analytics, and something they would want to know is, what's the churn on my app looking like? How many people are going to leave this month?
If you can predict that number, then you can take action on that. Maybe you send out a push notification and give them a discount. If people have items in the cart, and if they've held it for too long, you know they're not coming back. Again, you can send them an offer and get them back.
Age/gender demographics
We do age and gender demographics, an example of this would be let's say you're playing a game, Angry Birds. They never ask you for your age or gender but then how does someone on the product team get to know who's using this app?
Our solution to that is, on average, on any device, we have about 10 apps using Flurry. So without your knowledge, there are 10 apps at least on your phone sending us data.
Using that information, we can to a high degree of accuracy predict your age and gender. For example, if you have Snapchat, and if you have Venmo, and if you have some running app installed, you probably are in your early 20s, or late teens.
On the other hand, if you're using Cisco, eConnect, View and Okta, then you're probably an enterprise user and you're probably between 25 to 35. Then we give all of this information to who wants to look at it so the product managers can make more informed decisions.
Revenue analytics
We do revenue analytics, again, if you know that your revenue's falling beforehand, can you take some action based on this information?
DAU/MAU extrapolations is another use case.
Anomaly detection
The other one is anomaly detections. For example, if you send out an offer code coupon, a lot of times those coupon codes are abused. Can we detect some of the abuse use cases in apps?
These are some of the use cases I'm going to talk about.
Architecture
This is a super high-level diagram.
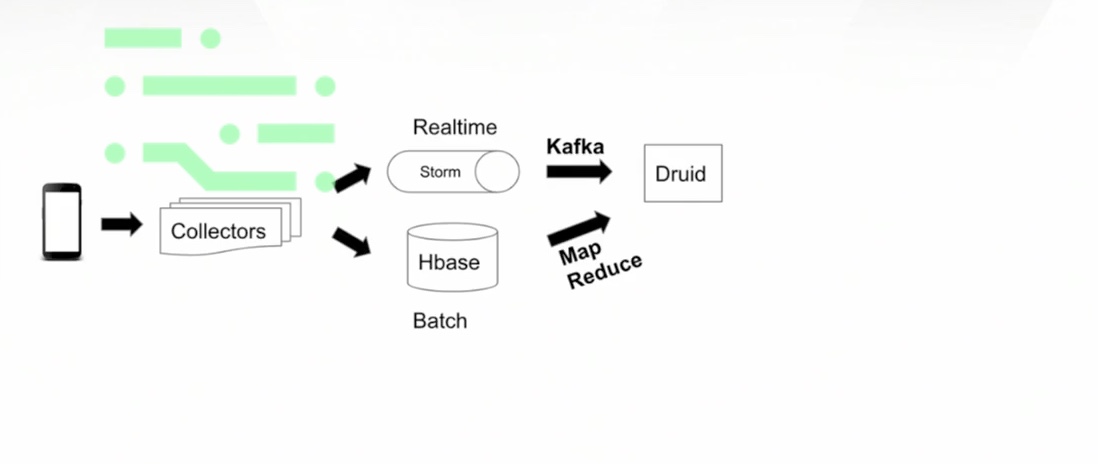
On the left, we have mobile devices where we start collecting data from so we have a bunch of collector processes, we collect this data, we fan them out to a real-time stream, as well as a batch process.
We process all this data using MapReduce and Kafka, we get this information into Druid.
Once this information is in Druid, that's when it becomes super powerful. On average, if an event hits our system, it takes about 500 milliseconds to navigate its way through Druid and actually for it to be queryable.
On the right side, you have a bunch of apps that would want to query this data, on the lower half, you have your traditional stuff, you have your UI, alerting mechanisms, typical query engines.
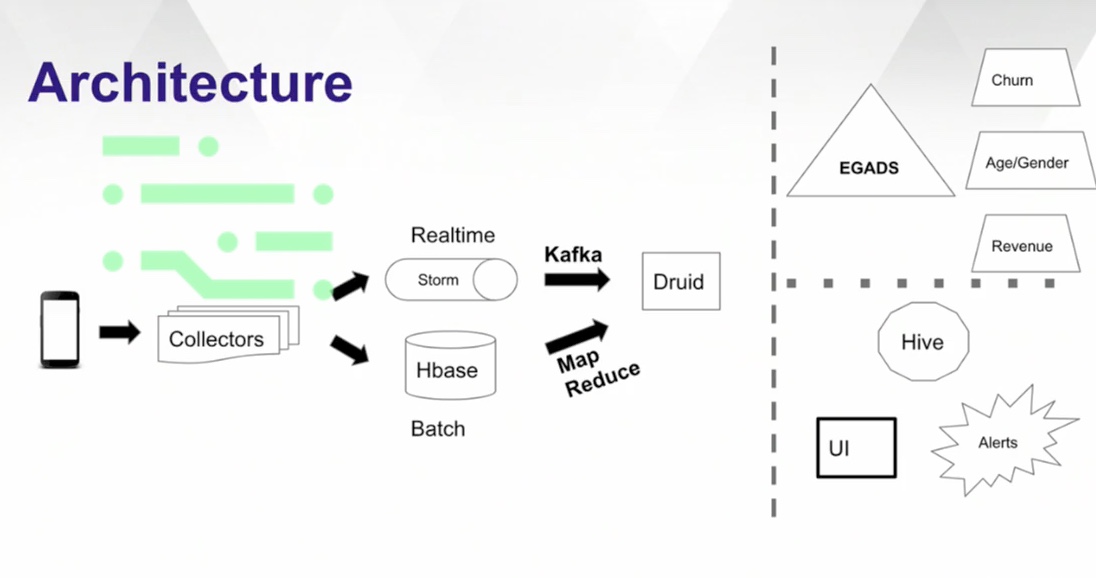
The top portion is more on the ML/AI side where you're trying to learn from this data.
That was about 60% of the hard work, taking an event, processing it, cleaning it, and getting it into a store that you can actually query on.
It gets pretty easy from here.
Querying Druid
The next step is to actually get data out of it. This is a sample payload.
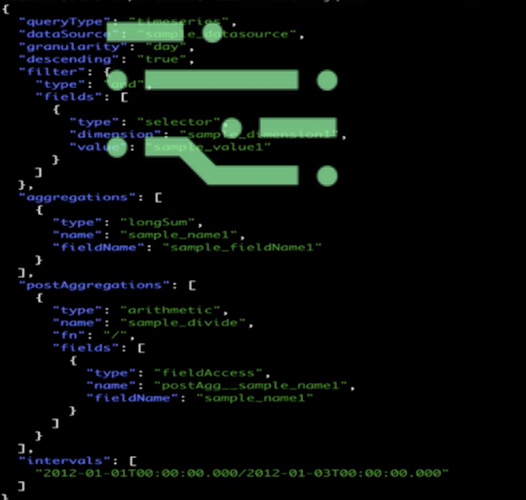
It looks pretty complicated but it's actually pretty simple. It's actually very flexible also.
One of the things that we need to keep in mind is, each category of app has a different churn ratio. For example, for games, the moment they launch they have very high virality and then they exponentially decay.
Productivity apps don't have that huge uptake, they're pretty flat and the decay is also flat. Things like news apps have a very, very, very slow growth curve. But once it reaches a significant volume, it could explode, there are network effects.
Using Druid, we can get out the exact data we need and then we can tune these models based on the category of the app.
Yahoo - EGADS
This brings me to the next system, which lets us do this actual time series forecasting and it's called EGADS. There has been absolutely zero creativity in trying to name this.
It's an extensible generic anomaly detection system. It's a standalone platform that can be deployed.
It supports a bunch of time series models, you can choose whatever works for you, depending on your use case. Also, it has anomaly detection modules.
What would a typical workflow look like?
What you would do is somehow get all of this raw data into a data store, you would periodically query that data, get the data out, feed it into your EGADS system, train the model continuously.
You would enable certain parameters, like auto-tuning, let it tune itself, let it figure out the right model.
When it's ready, in real-time, you can actually query the system and get the data out. But all of this is pretty cumbersome, you need to do so many things to make this work.
Yahoo Sherlock
We have another system called Yahoo Sherlock (I promise the last one).
This one's going to tie everything together, everything will make sense after this.
Sherlock is a system on Druid and EGADS, it abstracts out all the complexity that you see in running these large-scale forecasting pipelines.
It has automated monitoring, it's very scalable. The other thing is it has a lot of seasonality information in it.
One of the biggest problems with time series is, what sort of window do you use? You can have a trend that goes up and then down. If you focus only on the region which is going up, and you have a very small window, you'll only see the data going up, you will never find it going down.
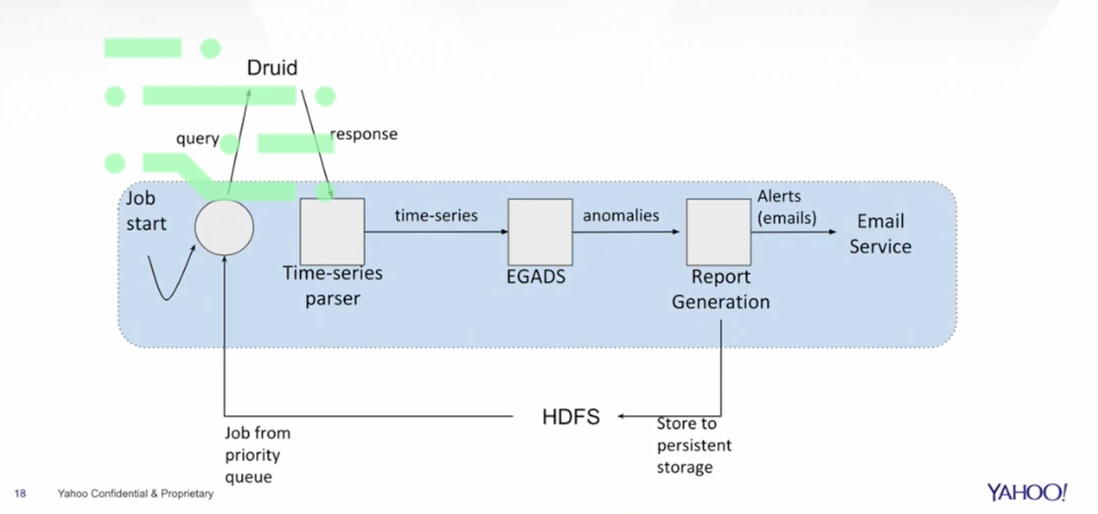
One of the biggest challenges always is to figure out the window that you need to process this data on. Alerting on anomalies - this is tying everything together.
You start a job that trains this data so you query Druid, you get a response back, you give it your time series parser, the time series gives it to the next system, which actually does the anomaly reduction and training of the model.
All the anomalies are actually reported, you can have emails sent out, you can have alerts fired, this data also gets stored in HDFS or any deep storage.
Then you can keep learning continuously from that.
We built all of this and the reason why we want to do that is to extrapolate this graph.
One example is the revenue graph, if you can extrapolate that graph and actually tell users in real-time that the revenue is actually going to fall, they can go ahead and proactively take an action on that.

Another thing I talked about was the age and gender estimates. That's more of a batch use case but all of that adds value to our customers.
Thank you.


AI accelerator insider insider
Thank you for subscribing
Level up your ai accelerator insider career & network with ai accelerator insider experts.
An email has been successfully sent to confirm your subscription.
 Follow us on LinkedIn

